Barrios Visibles: Building Footprint Evidence of Systematic Population Undercount in Argentina's Informal Settlements
04.16.2026
Cite as: Lebovits, N. (2026). Barrios Visibles: Building Footprint Evidence of Systematic Population Undercount in Argentina's Informal Settlements. SSRN Working Paper. https://ssrn.com/abstract=6588819
Abstract
Argentina's Registro Nacional de Barrios Populares (RENABAP) is the country's primary administrative record of informal-settlement population, listing approximately 1.24 million families across 6,467 registered barrios. I compare RENABAP's enumeration against 1.97 million building footprints from the combined Google-Microsoft-OpenStreetMap dataset, spatially joined to RENABAP polygons. Within registered settlement boundaries, detected footprints exceed recorded families by 59% in raw counts, and a per-settlement household floor—the maximum of (a) recorded families and (b) detected footprints scaled by RENABAP's own 1.1 families-per-dwelling ratio—exceeds RENABAP's national total by 83%. Under conservative population multipliers, this implies a total informal-settlement population of 6.3 to 7.6 million, or 2.9 to 3.4 million above the official figure (roughly 6 to 7% of Argentina's total population). The pattern is geographically bimodal: in CABA's consolidated vertical villas, RENABAP captures residents that footprints cannot (median 1.9 families per footprint); everywhere else, building counts substantially exceed family estimates, consistent with documented systematic undercounts of informal settlements in the international literature. The vertical-density regime decays sharply with distance from the urban core, from around 50% of settlements in inner-ring Conurbano partidos to under 10% in the outer ring. Because the national aggregate averages across these regimes, the peripheral undercount is larger than the 83% headline suggests. The analysis is fully reproducible using open data and open-source tooling, and detection quality is directly verifiable via a companion interactive web map.
1. Motivation
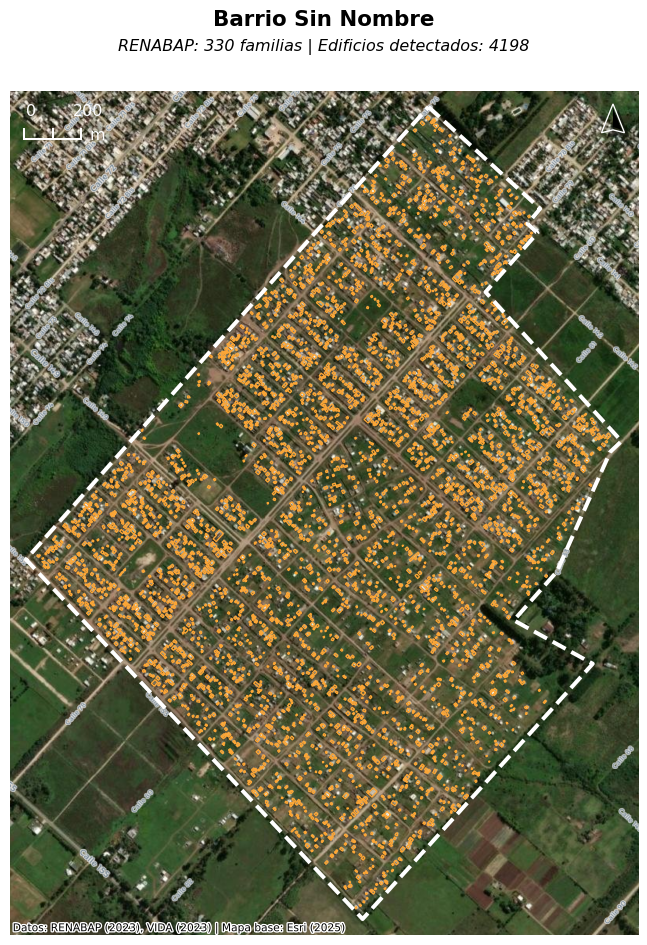
In 2025, I worked with the municipality of La Plata, Argentina to assess flood risk in informal settlements. The city's GIS team had been relying on RENABAP (Registro Nacional de Barrios Populares), Argentina's national registry of informal settlements, and I set out to supplement it with building footprint data for more precise household estimates (Smith et al., 2019). The two sources diverged sharply. Across La Plata's informal settlements, roughly 72,000 building footprints intersect polygons for which RENABAP lists only 34,000 families (Lebovits et al., 2025) — and in one Los Hornos settlement, RENABAP's 330 families sit against more than 4,200 footprints clearly visible in satellite imagery.
RENABAP's official documentation provides several plausible explanations for this large gap. The registry was built through a sequence of normatively-bounded survey waves: an initial 2015 to 2016 mass survey by TECHO, Cáritas, and UTEP-affiliated movements covering localities above 10,000 inhabitants, formalized as 4,100 barrios via Decreto 358/2017 (cutoff 31 December 2016); a 2017 update to 4,228 barrios via AABE Resolution 275/2017; a 2021 extension to localities of 2,000 to 10,000 inhabitants, formalized as 4,561 barrios via Decreto 880/2021 (cutoff 31 December 2018); and a further update via Decreto 573/2023 (cutoff 31 December 2021) (SISU, 2023, pp. 3–6). Family counts are not derived from a household census but from a three-source estimation combining referente declarations, field enumerator counts, and satellite-image dwelling counts, multiplied by a national average of 1.1 families per inhabited dwelling (pp. 14–15, 24). For many settlements, the underlying dwelling estimates are therefore 5 to 10 years old as of this writing, and the registry explicitly excludes dispersed rural population (p. 6). Settlement boundaries are also frozen at registration cutoffs (2016, 2018, 2021), so settlements that emerged or were reconfigured after these dates aren't in the registry. New settlements formed during the post-2023 economic deterioration are entirely missing, as the last available data were posted in December of 2023.
Academic and policy literature also affirms broad precedent for systemic population undercounts in informal settlements (Thomson et al., 2021; Breuer et al., 2024; Kuffer et al., 2022), and offers various reasons for difficulties in keeping census data in sync with the actual population of informal settlements, including infrequent census cycles and budgetary constraints on national statistical offices, particularly in resource-constrained contexts (Leete, 2001), and government non-recognition of informal settlements themselves (Avis, 2016).
In La Plata, I was able to present my findings to the municipal government, which has now incorporated the data into their first-ever comprehensive plan (Resa et al., 2025). Yet the scale of the discrepancy in La Plata—a city of only 800,000 people—made me wonder what this gap looked like nationally.
Recent national-scale work has begun to surface the geographic bias in informal-settlement monitoring. Samper et al. (2025) use RENABAP to show that the largest total informal-settlement area in Argentina is not in Greater Buenos Aires (216 km²) but in extra-small urban areas of 2,000 to 50,000 residents (267 km²), and that smaller cities expanded faster between 2016 and 2023 — up to 2.78% annually in small urban areas versus 1.44% in large metropolitan areas. Their analysis takes RENABAP's polygons and family counts as given. This paper is complementary: rather than asking where the registered area is concentrated and how fast it is growing, I ask whether, within the polygons RENABAP itself maintains, the recorded household count matches the built evidence. The two critiques operate on orthogonal axes — geographic coverage and internal enumeration — and, as discussed in §5, their implications compound.
2. Data Sources
This analysis uses three datasets.
Settlement boundaries and family counts come from RENABAP (Registro Nacional de Barrios Populares), the official Argentine registry of barrios populares, maintained by the Secretaría de Integración Socio-Urbana (SISU). The dataset contains 6,467 settlement polygons with associated names and estimated family counts, totaling 1,237,795 families nationally. According to the registry's official methodology manuals (SISU, 2023), dwelling counts for each polygon are derived from three converging sources—declarations by community referentes, on-the-ground enumerator counts, and dwelling counts from satellite imagery (SISU, 2023, p. 24)—and family counts are estimated by applying a national multiplier of 1.1 families per inhabited dwelling, a ratio derived from subsequent house-by-house surveys across registered barrios (pp. 14–15). The snapshot used here, dated 6 December 2023, is the most recent publicly available release and was obtained via the Mapa de Barrios Populares (RENABAP, 2023). URLs for the registry, its Observatorio, and the GeoJSON snapshot are listed in the Data and Code Availability section.
RENABAP was created by Decreto 358/2017 and given its operational mandate by Ley 27.453 (2018), which declares the integración socio urbana of registered barrios to be of public interest. That law defines integración socio urbana as a suite of actions—expansion of social infrastructure, service access, treatment of public spaces, environmental sanitation and mitigation, strengthening of family economic activities, parcelary redimensioning, tenure security, and dominial regularization—of which titling is one component among many. The registry's own baja criteria reflect this: a barrio is removed only when it achieves both dominial regularity and formal service access, never on titling alone (SISU, 2023). Accordingly, municipal and provincial governments use RENABAP to target infrastructure investment (water, sewer, electrification, stormwater); national programs including the Fondo de Integración Socio Urbana allocate resources against the registry; and—as in La Plata's recent comprehensive plan—it serves as the de facto population basis for planning in the absence of any alternative settlement-level census product.
Building footprints come from the combined Google-Microsoft-OpenStreetMap dataset assembled by VIDA, which merges Google's V3 Open Buildings, Microsoft's GlobalMLFootprints, and OpenStreetMap into a single global dataset of approximately 2.7 billion footprints, distributed via Source Cooperative as country-partitioned GeoParquet files (VIDA, 2024). The Google (Sirko et al., 2021) and Microsoft (Microsoft, 2022) footprints are derived from deep learning models applied to high-resolution satellite imagery; OSM footprints are human-contributed. VIDA was selected for its ease of access at the time the original La Plata analysis was conducted in August 2025; alternative sources such as Overture Maps, which offers a similar combined building layer with more frequent updates, would be reasonable substitutes for future iterations. These datasets have been validated as reliable inputs for high-resolution population estimation (Boo et al., 2022).
Building-footprint derivation from satellite imagery is imperfect, particularly in dense urban contexts, where detection accuracy is somewhat lower in informal settlements than in formally-planned neighborhoods (Okyere, Lu, & Brunn, 2025). The VIDA snapshot used here was last updated in September 2024, predating any subsequent construction in actively growing settlements. I do not apply confidence filtering: the VIDA dataset already represents Google's quality-filtered output (footprints with confidence ≥ 0.65), and the relevant source of uncertainty in informal-settlement detection is false negatives—structures missed by the model—which no confidence threshold can address. I do apply area filtering as a sensitivity test, reporting results across lower thresholds of 0, 6, and 10 m². These thresholds are calibrated to exclude clearly non-residential micro-structures (latrines, sheds, animal enclosures) while retaining all footprints plausibly inhabitable as one-room dwellings. I do not apply an upper threshold: in informal settlements, large structures are predominantly multi-family residential, and filtering them would undercount rather than overcount. Full sensitivity tables are reported in the appendix.
Urban-extent classification uses the Planta Urbana layer published by Argentina's Instituto Geográfico Nacional (IGN, 2021), which delineates each Planta Urbana polygon as an approximate urban area covering the contiguous zone of built blocks with recognizable limits. The layer is part of IGN's Hábitat e Infraestructura Social dataset, covers all of Argentina, is distributed as a shapefile in WGS 1984 (EPSG:4326), and is updated monthly. It is used here to classify each RENABAP settlement as intersecting or not intersecting an IGN-recognized urban area, supporting the urban/non-urban split reported in Appendix A.2.
3. Results
Across 6,467 registered settlements, 1,969,975 building footprints intersect settlement polygons—59% more than RENABAP's 1,237,795 recorded families. Applying RENABAP's own 1.1 families-per-dwelling ratio to footprint counts and taking the per-settlement household floor defined in §4.2 yields an estimated 2,265,499 households, or 83% above the official figure. Under conservative population multipliers, this implies a total informal-settlement population of roughly 6.3 to 7.6 million, against an official total of 3.5 to 4.1 million.
Table 1. National summary.
| Metric | RENABAP Official | Building-Based Estimate | Difference |
|---|---|---|---|
| Settlements | 6,467 | 6,467 | — |
| Building footprints (within polygons) | — | 1,969,975 | — |
| Families / households | 1,237,795 | 2,265,499 | +1,027,704 (+83.0%) |
| Population (×2.8) | 3,465,826 | 6,343,398 | +2,877,572 |
| Population (×3.35) | 4,146,613 | 7,589,423 | +3,442,810 |
| Undercount as share of Argentina's population | — | — | 6.2% – 7.4% |
Table 2. Settlements by aglomerado tier.
| Aglomerado tier | Settlements | RENABAP higher | Footprints higher | Median ratio (footprints / families) |
|---|---|---|---|---|
| CABA | 49 | 43 | 6 | 0.53 |
| Conurbano-AMBA | 1,307 | 176 | 1,127 | 1.76 |
| Other Gran Aglomerados | 850 | 108 | 739 | 1.73 |
| Outside Aglomerados | 4,259 | 302 | 3,938 | 1.88 |
In CABA, building footprints undercount families due to vertical multi-story construction in consolidated villas. Everywhere else, the pattern reverses: building counts substantially exceed official family estimates, even after applying RENABAP's own 1.1 families-per-dwelling multiplier.
4. Methodology
In this analysis, I aggregated building footprints to settlement boundaries using a spatial join. The use of building footprints as a proxy for household counts is an established methodology in high-resolution population estimation (Boo et al., 2022). This approach is also consistent with RENABAP's own methodology, which uses satellite imagery to manually count dwellings as one of three converging sources for its population estimates (SISU, 2023, p. 24).
4.1 Counting Building Footprints
The analysis itself proceeded in three steps. First, both datasets were downloaded for the sake of query speed, rather than sourced remotely. The data were then converted to optimized GeoParquet files, including ZSTD compression, Hilbert spatial sorting, optimized row group sizes, and bounding box covering metadata, all in order to enable efficient spatial queries on large datasets. This was done using geoparquet-io (https://geoparquet.io/). Lastly, the data were processed in DuckDB using simple spatial queries. Building footprints were joined to settlement boundaries using spatial intersection. This query counts the number of building footprints that intersect each settlement polygon. With spatial indexing from the optimization step, the join across 6,467 settlement boundaries and 33.8 million national building footprints completes in approximately 3 seconds. A second spatial join against IGN's Planta Urbana layer flags each settlement as intersecting or not intersecting an IGN-recognized urban area. This flag is descriptive, not generative — it does not enter the household-floor calculation in §4.2 — and supports the urban/non-urban split reported in Appendix A.2.
4.2 Assessing Household Undercount
For each settlement, I take the household floor as the maximum of (a) RENABAP's recorded family count and (b) the detected building-footprint count scaled by RENABAP's own 1.1 families-per-dwelling ratio (SISU, 2023, pp. 14–15), optionally discounted by an occupation rate in sensitivity analysis. The occupation rate is applied only to the building-derived side; RENABAP already provided an enumerated family count that requires no further discount. The two components of the floor capture different mechanisms of undercount, and which one is larger depends on how the settlement is built. In low-rise settlements, each footprint corresponds to at least one dwelling, so the footprint-derived count establishes the floor. In multi-story settlements, a single footprint contains stacked dwellings, so the footprint count understates households, and RENABAP's field walk-through enumeration establishes the floor instead. I am not estimating the household count in each settlement; I am establishing a floor below which it cannot reasonably fall.
Summed nationally, raw building footprints exceed official RENABAP family estimates by 59%, and the per-settlement household floor exceeds RENABAP's total by 83%. Footprints (scaled by 1.1) are the larger value in 5,810 of 6,467 settlements; RENABAP is larger in 655 (the remainder are ties). Because CABA's reverse pattern partially offsets the peripheral undercount in the national aggregate, the true peripheral undercount is larger than the national headline suggests.
The two regimes are geographically distinct. In the Ciudad Autónoma de Buenos Aires, RENABAP records 80,517 families across 27,987 footprints: a median ratio of 0.53, or roughly 1.9 families per footprint, consistent with the consolidated multi-story villas that characterize the city (comparable to the ~3 families per structure documented in Mexico City's Isidro Fabela; Reyes, 2021). Outside CABA the pattern reverses: building counts substantially exceed official family estimates. This is consistent with a broad international literature showing that conventional population products systematically undercount informal settlements. Thomson et al. (2021) offer the clearest benchmark: comparing nine widely-used gridded population datasets (LandScan, WorldPop, HRSL, GRID3, GHS-POP, and others) against resident-enumerated counts across 118 slum settlements in Lagos, Port Harcourt, and Nairobi, they found that every product severely underestimated slum populations, with the best performer (HRSL) capturing only 39% of field-referenced residents. The undercount was worst in the densest settlements. They attribute this to two structural problems that apply directly to RENABAP: top-down disaggregation assumes admin-unit average densities hold at fine scale (collapsing precisely where density is most extreme), and most products lack a building-density auxiliary that would let the model resolve intra-urban heterogeneity. Related work reaches similar conclusions across other contexts (Carr-Hill, 2013; Lucci et al., 2018; Kuffer et al., 2022; Breuer et al., 2024). That these regimes are geographically distinct is what justifies settlement-level maxima over a single national multiplier—different settlements undercount through different mechanisms, and a uniform correction would obscure rather than reveal the pattern.
Within Conurbano-AMBA, vertical density decays sharply with distance from the urban core. Eighty-eight percent of CABA settlements show vertical density, with a median ratio of 0.53. The inner ring of partidos adjacent to CABA approaches this; the outer ring drops to single digits.
Table 3. Vertical density gradient across Conurbano partidos.
| Partido | Ring | N settlements | RENABAP higher | % vertical |
|---|---|---|---|---|
| Vicente López | Inner | 15 | 8 | 53% |
| San Isidro | Inner | 17 | 9 | 53% |
| General San Martín | Inner | 45 | 22 | 49% |
| Lanús | Inner | 26 | 11 | 42% |
| Tres de Febrero | Inner | 20 | 8 | 40% |
| Malvinas Argentinas | Outer | 53 | 5 | 9% |
| Tigre | Outer | 67 | 5 | 8% |
| Almirante Brown | Outer | 74 | 5 | 7% |
| Merlo | Outer | 90 | 6 | 7% |
Outside AMBA, vertical-density rates fall further: among Other Gran Aglomerados, 108 of 850 settlements (13%) have RENABAP counts exceeding the footprint-derived estimate; outside any aglomerado, only 302 of 4,259 (7%) do. The gradient tracks informal-settlement consolidation theory: older core-adjacent settlements have had longer to densify vertically, while newer peripheral settlements remain horizontal.
4.3 Estimating Total Population
Total population estimates use two persons-per-household multipliers: 2.8, the 2022 INDEC national average (INDEC, 2023), and 3.35, derived from RENABAP's own 2016–2017 enumeration of 526,686 families and 1,763,248 persons across 4,428 settlements (SIEMPRO, 2021, p. 7). The lower figure provides a conservative floor against the national distribution; the higher figure reflects the larger household sizes documented in barrios populares.
Applied to the 2,265,499 household floor (no size filter, 100% occupation), these multipliers yield a baseline national estimate of 6,343,398 to 7,589,423 informal-settlement residents. Under the most conservative sensitivity specification (≥10 m² footprint filter, 85% occupation rate, 2.8 persons per household), the estimate remains at 5,340,576 residents—still well above RENABAP's implied total of roughly 3.5 million. Full sensitivity analysis is reported in the appendix.
4.3.1 On occupation rates
The sensitivity analysis in §4.3 treats occupation rates of 85%, 90%, 95%, and 100%, but the lower end of that range is almost certainly too conservative for informal settlements. Three independent lines of evidence converge on the claim that habitable dwellings in informal settlements are effectively always occupied.
First, ethnographic and urban-studies work on Buenos Aires villas documents that once a settlement exhausts horizontal land, it densifies vertically and develops an internal informal rental market. Rodríguez, Rodríguez & Zapata (2018), drawing on Cravino (2006), document this transition directly: from the mid-1990s onward, agotamiento de los predios vacantes — exhaustion of vacant lots — drove vertical growth in the traditional villas, accompanied by informal mechanisms for sale-purchase of dwellings and room rental, intensifying in the following decade. They note that the informal "secondary" market has grown significantly because "in many cities it is no longer possible to occupy more land — there is none left" (Rodríguez et al., 2018, p. 127, my translation). Between the 2001 and 2010 censuses, villa population in CABA grew 52.3 percent (from 107,422 to 163,587 inhabitants) while villas occupied only 1.46 percent of CABA's territory (Cravino, Del Río & Duarte, 2008, cited in Rodríguez et al., 2018). Benitez (2022) extends the observation: informal residents in central CABA grew from 52,000 in 1991 to contested current estimates of approximately 227,000 even as few new settlements emerged and existing ones expanded little horizontally, with estimates suggesting that 30 to 50 percent of residents of CABA informal settlements now rent rooms. The mechanism — population growth without footprint growth — is exactly the geometry that makes a footprint-based population floor under-count in CABA specifically.
Second, the remote-sensing literature converges on the same conclusion from morphology. Kuffer, Pfeffer & Sliuzas (2016) identify the diagnostic slum signature as higher roof coverage density, organic patterns, and small building sizes. This is, in effect, the morphology of a dwelling stock at occupational saturation — circulation reduced to footpaths, the built fraction approaching the parcel fraction. Mahabir et al. (2018) describe the standard slum life-cycle as infancy → consolidation → maturity, with vertical densification possible at the maturity stage. The morphology used to detect informal settlements from satellite imagery is, in effect, the physical signature of a stock at or approaching occupational saturation.
Third, the structural literature frames informal settlements as the persistent housing outcome of a binding supply shortage. UN-Habitat (2003) identifies the drivers of slum formation as rapid rural-to-urban migration, urban poverty and inequality, inability of the urban poor to access affordable land, and insufficient investment in low-income housing. UN-Habitat (2016) documents the resulting trajectory: as public housing declined in the late twentieth century, informal settlements burgeoned, and absolute slum population grew from 689 million in 1990 to 880 million in 2014 even as the proportion of the urban population in slums fell from 46.2 to 29.7 per cent over the same period. Informal stock in this framing is not residual temporary overflow; it is the standing housing solution for a large and growing population unable to access formal alternatives. UN-Habitat's operational slum definition incorporates overcrowding — more than three people sharing the same habitable room — as one of five core deprivations (UN-Habitat, 2018); a stock defined by overcrowding cannot by construction contain meaningful vacancy.
One apparent counterexample deserves preemption: formal resettlement housing built to replace informal settlements often sits vacant or is rejected by intended residents. UN-Habitat (2003) documents that forced relocation destroys affordable stock while replacement housing frequently turns out to be unaffordable, with relocated households moving back into slum accommodation. Benitez (2022) describes the same dynamic in the Playón de Chacarita relocation programme in Buenos Aires, where community organizers and residents express serious reservations about the planned move to adjacent social-housing apartment buildings. This is a distinct phenomenon — formal-sector supply failing to match demand characteristics — and does not bear on whether the informal stock itself clears. If anything it strengthens the argument: residents prefer staying in fully-occupied informal dwellings to moving to formal alternatives.
The 85% floor in the sensitivity table is therefore a deliberately permissive lower bound rather than a central estimate. It absorbs a second source of uncertainty not captured by the vacancy literature—the fraction of detected footprints that are habitable dwellings rather than sheds, latrines, kitchen outbuildings, or partial construction. Vacancy of habitable dwellings itself is best treated as near zero.
4.4 Validation
These findings are preliminary and have not been formally ground-truthed; this paper is intended to generate the political will for such ground-truthing, not to substitute for it. Systematic field enumeration remains a need this paper motivates rather than satisfies.
A census-based cross-check is not informative here. The 2022 INDEC operation faced well-documented coverage difficulties in informal settlements (Ocar et al., 2023; Marín 2023), and RENABAP's own family-size parameters are derived from the same state statistical apparatus that produced the census — the two are not independent measurements. Field ground-truthing is the only substantively meaningful validation strategy.
The CABA operation illustrates the non-independence concretely. Enumeration in the city's villas was delegated to the Ministerio de Desarrollo Humano y Hábitat and coordinated through barrio referentes, delegados, and social organizations — the same community infrastructure that RENABAP relies on for its family-count estimates (Gómez, 2022). The projections going in were drawn from the 2010 census, and the city's own Dirección General de Estadísticas y Censos anticipated that the resulting figures might undercount informal-settlement population. A comparison between RENABAP and the 2022 census is therefore a comparison between two products of overlapping operational infrastructure working from a shared 2010 baseline, not two independent measurements of the same underlying reality.
In place of formal validation, I draw on informal prior work and provide two transparency mechanisms for readers to assess detection quality directly. During earlier research in La Plata, I examined the most recently available high-resolution satellite basemaps for most of the area's informal settlements and visually confirmed that footprint polygons generally match existing buildings. In several cases the discrepancies were acute: a newer settlement in the Los Hornos neighborhood is listed by RENABAP as home to 330 families, whereas the area currently contains more than 4,200 building footprints. Applying the 1.1 families-per-dwelling and 2.8–3.35 persons-per-household multipliers to La Plata yielded an estimated 221,000 to 265,000 informal-settlement residents, against an official figure of approximately 112,000—a discrepancy consistent with the national pattern documented above.
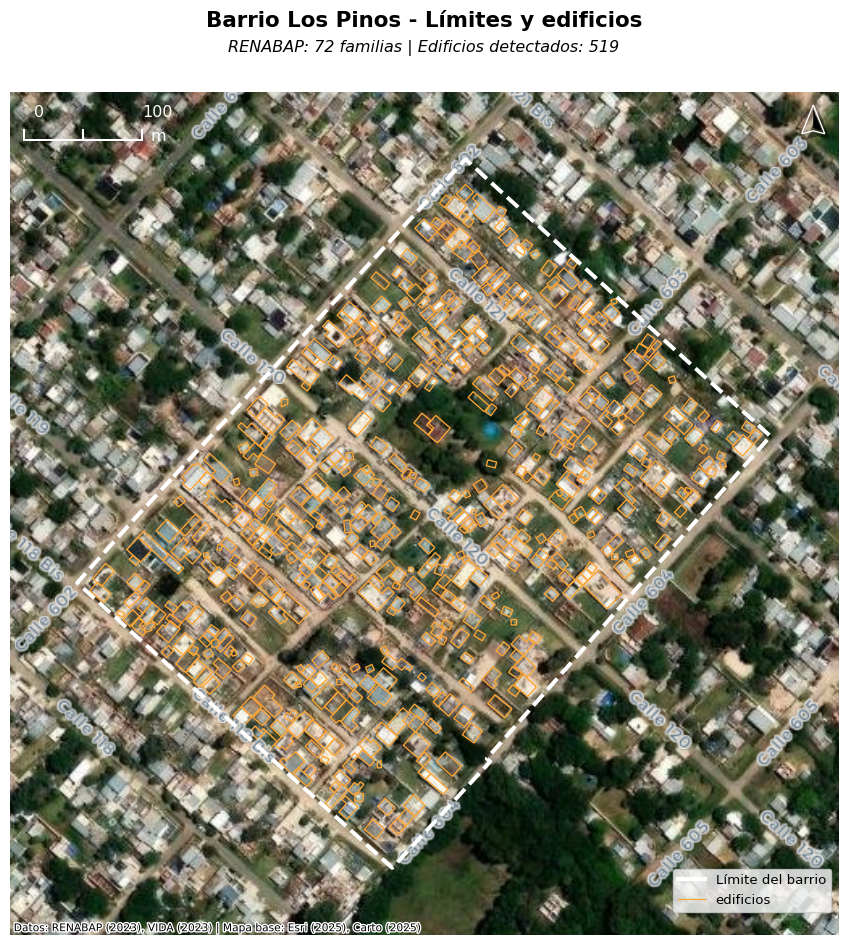
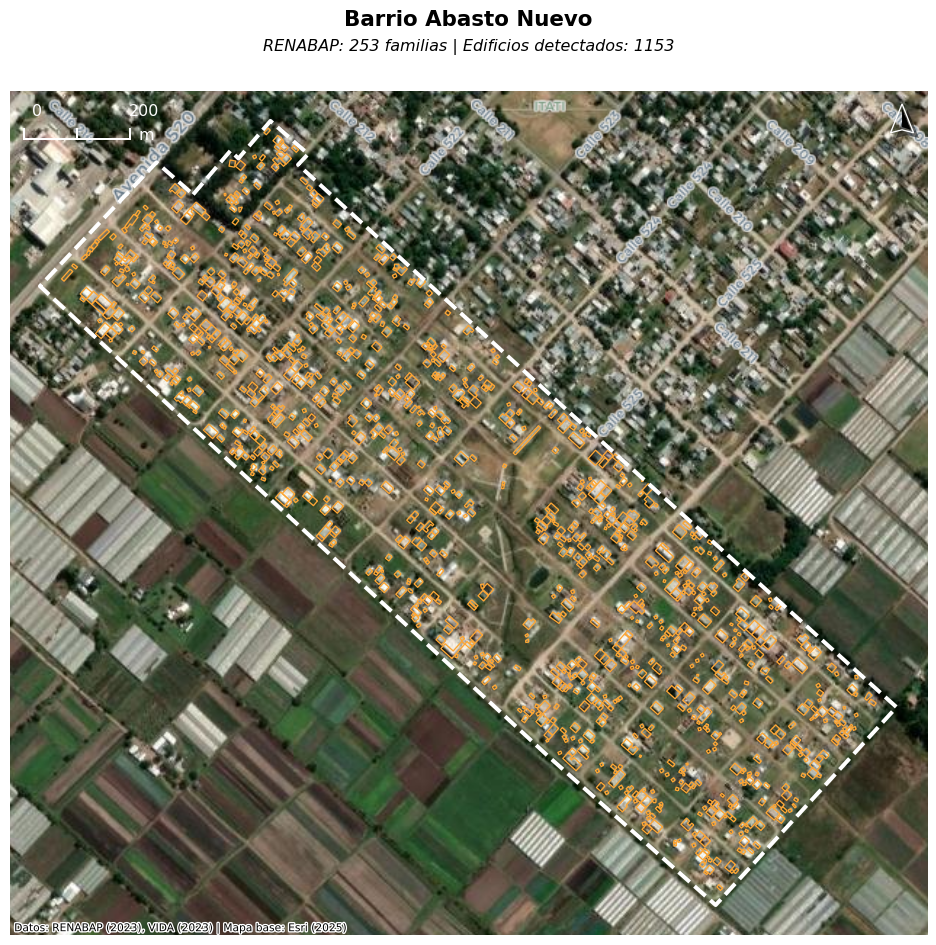
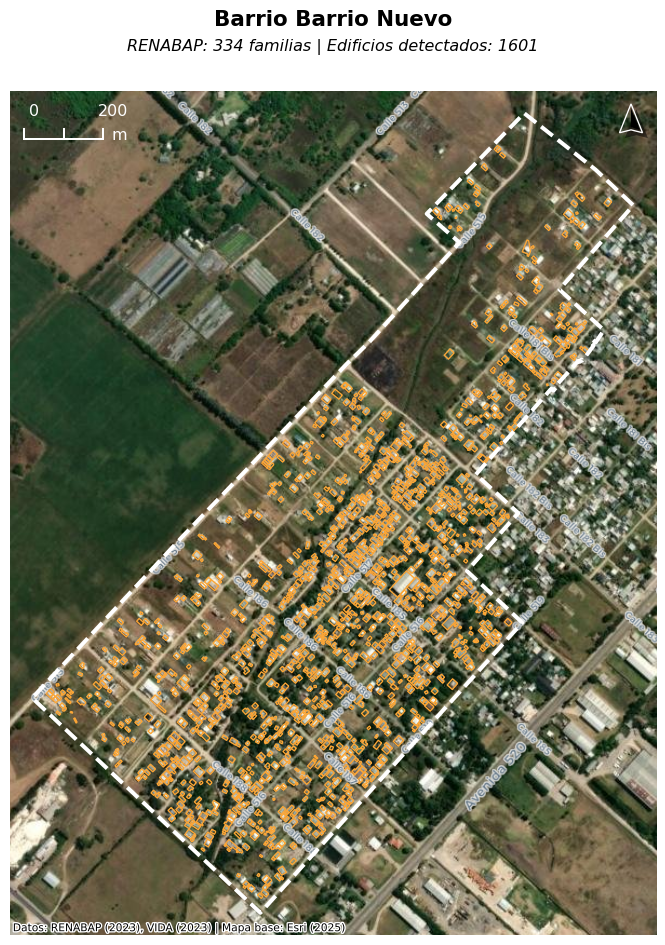
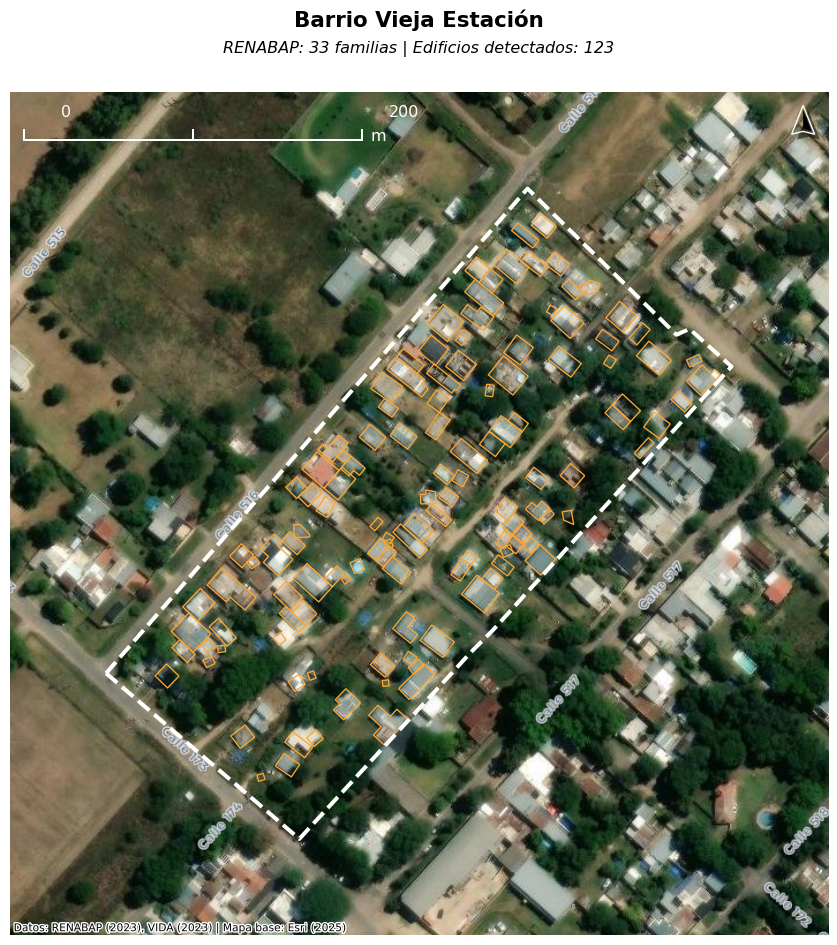
Beyond this informal check, the paper and its companion web map offer two mechanisms for direct reader verification. First, the paper includes high-resolution basemap imagery with overlaid footprints for five illustrative settlements. Second, an interactive web map at https://barriosvisibles.org displays every settlement boundary and every building footprint in Argentina against current high-resolution basemap imagery, allowing any reader to examine detection quality across the full study area.
5. Discussion
The core finding of this paper is that RENABAP's enumeration of Argentina's informal-settlement population is systematically low. Summed nationally, raw building footprints exceed RENABAP's recorded family counts by 59%, and the per-settlement household floor—applying RENABAP's own 1.1 families-per-dwelling ratio to footprint counts—exceeds RENABAP's total by 83%. Under conservative assumptions this implies an undercount on the order of 2.9 to 3.4 million people, and likely more: the national aggregate averages across the two regimes documented in §4.2, so the peripheral gap is larger than the 83% headline suggests.
This pattern replicates the systematic undercount documented across gridded population products in Thomson et al. (2021), who found that none of nine widely-used products captured more than 39% of field-enumerated slum residents across 118 settlements in Lagos, Port Harcourt, and Nairobi. Although RENABAP is a field registry rather than a gridded product, it inherits the same structural vulnerability: without a building-level floor, a single enumeration approach cannot resolve the density heterogeneity that defines informal settlements. Related work reaches similar conclusions across other contexts (Carr-Hill, 2013; Lucci et al., 2018; Kuffer et al., 2022; Breuer et al., 2024).
5.1 Relationship to prior national-scale work
These findings compound with recent area-based work. Samper et al. (2025) document that Argentina's informal-settlement area is geographically more dispersed than global monitoring assumes: extra-small urban areas hold 267 km² against 216 km² in Greater Buenos Aires, and small cities grew at 2.78% annually between 2016 and 2023 against 1.44% in large metropolitan areas. My results indicate that, within those same polygons, registered household counts are a low floor on actual household counts — and that the gap between building evidence and family counts is largest precisely in the peripheral, horizontally-developed settlements that dominate the smaller-city categories. The vertical-density regime documented in §4.2, which keeps CABA's household floor bounded by RENABAP rather than by footprint count, decays sharply with distance from the urban core; outside CABA, roughly 90% of settlements sit in the horizontal regime where footprint counts substantially exceed registered families. The geographic bias identified by Samper et al. and the enumeration gap identified here therefore reinforce one another: the cities that global monitoring already neglects are also the cities where the national registry most substantially undercounts.
Samper et al.'s 2016–2023 area-based growth rates should be read with attention to RENABAP's registration waves. The 2016 baseline covered only localities above 10,000 inhabitants (Decreto 358/2017); the extension to localities of 2,000 to 10,000 was formalized only in 2021 (Decreto 880/2021), with a registration cutoff of 31 December 2018. The 2018 growth peak — 991 new settlements nationally, with the highest proportional increases (6.18%, 5.06%, 4.17%) concentrated in medium, small, and extra-small urban areas — falls at the cutoff for the later-added locality-size tier. The mechanism is explicitly acknowledged by RENABAP itself. In a 2023 Infobae interview discussing the most recent registry update, Juan Manuel D'Attoli — coordinator of RENABAP and a co-author of Samper et al. (2025) — explained that new entries added during a registration wave do not necessarily indicate new settlements, but rather include "barrios — muchos de ellos antiguos — que no se habían registrado previamente" [settlements, many of them old, that had not been previously registered] (Infobae 2023). Although Samper's team retro-mapped growth from satellite imagery, the settlements in question had first to be field-identified through the later survey waves. Some fraction of the apparent 2016–2023 growth in the smaller-city categories is therefore retrospective registration catch-up rather than contemporaneous physical expansion. This does not weaken the cross-sectional finding about where informal area concentrates; if anything it strengthens the case that the static total is more peripherally weighted than the year-by-year growth curve alone suggests.
5.2 Limitations
Several sources of error remain unaddressed by this analysis. Settlement boundaries change over time relative to those recorded by RENABAP, and the relationship between buildings, households, and persons per household is itself uncertain. Settlement-level variation in that relationship—especially vertical density, as documented in §4.2—is only partially captured by the max-of-two approach; settlements with mixed vertical and horizontal construction may be understated by either component of the floor.
A more structural limitation is coverage. RENABAP only registered settlements meeting size minima for the surrounding locality—initially >10,000 inhabitants, later relaxed to >2,000—so settlements in smaller localities are absent from the registry entirely. This analysis cannot detect them, because there is no polygon against which to spatially join building footprints. Whatever population lives in sub-threshold-locality informal settlements is therefore missing from both RENABAP's count and mine, and the true national informal-settlement population is correspondingly higher than either figure.
A reader might object that RENABAP was never designed to enumerate all occupants, only titleable households. As noted in §2, however, Ley 27.453 gives the registry a mandate that extends well beyond titling, and in practice it serves as the population basis for infrastructure planning, resource allocation, and service delivery. That downstream use—not any narrower original purpose—is what this paper critiques.
5.3 On the staleness objection
One obvious objection to the finding warrants direct preemption: that the gap merely reflects registry staleness—that RENABAP's figures are accurate as of enumeration but have fallen behind subsequent growth. This interpretation is not supported by RENABAP's own methodology. The registry provides for continuous updating through territorial visits, satellite analysis, and external submission forms (SISU, 2023). More decisively, RENABAP's own quality-control protocol explicitly requires that estimated family counts be consistent with the number of dwellings visible in satellite imagery: "Verificar que la cantidad de familias estimada sea consistente con la cantidad de viviendas que se ven desde la imagen satelital" (SISU, 2023). The gap documented in this paper is therefore not a lag between a static registry and a changing reality. It is a departure from RENABAP's own stated QA criterion, within polygons the registry itself has validated and actively maintains. The implication is that closing this gap requires methodological change, not merely temporal updating. An enumeration approach that does not incorporate building-level evidence as a floor will continue to undercount, even under perfect operational execution of RENABAP's current protocols. The substantive policy stakes—resource allocation, service provision, political representation—make this more than a measurement problem.
6. Conclusion
Official data state that approximately 4.1 million people live in Argentina's informal settlements. Building-footprint analysis suggests the actual figure is closer to 6.3 to 7.6 million, with at least 2.9 million people—and likely closer to 3.4 million—unaccounted for in official records. Population estimation in informal settlements is notoriously difficult, but this discrepancy has real consequences. Flood risk assessments, infrastructure planning, and service delivery all depend on accurate population data. When a national registry undercounts by roughly 80% against its own building-level evidence, planning decisions are made on a false foundation.
The methodology presented here is simple: a spatial join between settlement boundaries and building footprints, with a per-settlement max-of-two household floor—using RENABAP's own 1.1 families-per-dwelling ratio on the building-derived side—applied as a conservative lower bound. It runs in seconds on a standard laptop using open data and open-source tools. The full analysis is reproducible.
The purpose of this analysis is not to replace proper census operations, but to demonstrate the gap between official data and reality—and to show that, thanks to advances in open data and geospatial technology, detecting and quantifying this gap requires no specialized equipment, no field work, and no proprietary data. In a country with a relatively robust open data ecosystem and a relatively well-documented informal sector, these tools surface millions of unaccounted-for people representing something on the order of 6 to 7% of the total population. What does the gap look like elsewhere?
Data and Code Availability
All data used in this analysis are freely available at the URLs cited in §2. The analysis code is published as a public GitHub gist at https://gist.github.com/nlebovits/fd3e5f9a0e5ea1eeb4c6313917fbbbbe. An interactive web map at https://barriosvisibles.org displays every settlement boundary and every building footprint in Argentina against current high-resolution basemap imagery, enabling readers to explore the estimates and visually verify detection quality settlement by settlement.
Appendix
A.1 Sensitivity Analysis
Estimated households and population across building size filters, occupation rates, and population multipliers. Range: 1,907,348 – 2,265,499 households; 5,340,576 – 7,589,423 population (11.4% – 16.3% of Argentina's total population).
| Size filter | Occupation | Pop mult | Buildings | Est. households | Est. population | % of Argentina |
|---|---|---|---|---|---|---|
| No filter | 85% | 2.8 | 1,969,975 | 1,966,580 | 5,506,425 | 11.79% |
| No filter | 85% | 3.35 | 1,969,975 | 1,966,580 | 6,588,045 | 14.11% |
| No filter | 90% | 2.8 | 1,969,975 | 2,064,787 | 5,781,404 | 12.38% |
| No filter | 90% | 3.35 | 1,969,975 | 2,064,787 | 6,917,038 | 14.81% |
| No filter | 95% | 2.8 | 1,969,975 | 2,164,567 | 6,060,788 | 12.98% |
| No filter | 95% | 3.35 | 1,969,975 | 2,164,567 | 7,251,300 | 15.53% |
| No filter | 100% | 2.8 | 1,969,975 | 2,265,499 | 6,343,398 | 13.58% |
| No filter | 100% | 3.35 | 1,969,975 | 2,265,499 | 7,589,423 | 16.25% |
| ≥6 m² | 85% | 2.8 | 1,962,707 | 1,960,296 | 5,488,831 | 11.75% |
| ≥6 m² | 85% | 3.35 | 1,962,707 | 1,960,296 | 6,566,994 | 14.06% |
| ≥6 m² | 90% | 2.8 | 1,962,707 | 2,058,032 | 5,762,490 | 12.34% |
| ≥6 m² | 90% | 3.35 | 1,962,707 | 2,058,032 | 6,894,407 | 14.76% |
| ≥6 m² | 95% | 2.8 | 1,962,707 | 2,157,374 | 6,040,647 | 12.94% |
| ≥6 m² | 95% | 3.35 | 1,962,707 | 2,157,374 | 7,227,203 | 15.48% |
| ≥6 m² | 100% | 2.8 | 1,962,707 | 2,257,846 | 6,321,971 | 13.54% |
| ≥6 m² | 100% | 3.35 | 1,962,707 | 2,257,846 | 7,563,787 | 16.20% |
| ≥10 m² | 85% | 2.8 | 1,900,612 | 1,907,348 | 5,340,576 | 11.44% |
| ≥10 m² | 85% | 3.35 | 1,900,612 | 1,907,348 | 6,389,618 | 13.68% |
| ≥10 m² | 90% | 2.8 | 1,900,612 | 2,000,911 | 5,602,552 | 12.00% |
| ≥10 m² | 90% | 3.35 | 1,900,612 | 2,000,911 | 6,703,053 | 14.35% |
| ≥10 m² | 95% | 2.8 | 1,900,612 | 2,096,321 | 5,869,700 | 12.57% |
| ≥10 m² | 95% | 3.35 | 1,900,612 | 2,096,321 | 7,022,677 | 15.04% |
| ≥10 m² | 100% | 2.8 | 1,900,612 | 2,193,014 | 6,140,441 | 13.15% |
| ≥10 m² | 100% | 3.35 | 1,900,612 | 2,193,014 | 7,346,599 | 15.73% |
A.2 Estimate Source by Urban Intersection
Share of settlements in which the building-footprint count (scaled by 1.1) versus the RENABAP family count established the per-settlement household floor, split by whether the settlement intersects an IGN Planta Urbana polygon.
| Urban? | Settlements | Used buildings | Used RENABAP | % buildings | % RENABAP |
|---|---|---|---|---|---|
| Yes | 5,381 | 4,811 | 570 | 89.4% | 10.6% |
| No | 1,084 | 999 | 85 | 92.2% | 7.8% |
A.3 Province Breakdown
| Provincia | Settlements | RENABAP | Buildings | Est. families | Used bldg | Used RENABAP |
|---|---|---|---|---|---|---|
| Buenos Aires | 2,065 | 588,779 | 997,923 | 1,120,504 | 1,844 | 221 |
| Santa Fe | 469 | 92,776 | 134,135 | 153,206 | 413 | 56 |
| Chaco | 442 | 55,821 | 107,871 | 118,824 | 425 | 17 |
| Misiones | 413 | 58,322 | 88,822 | 101,200 | 348 | 65 |
| Tucumán | 370 | 48,003 | 82,136 | 92,044 | 356 | 14 |
| Ciudad Autónoma de Buenos Aires | 49 | 80,517 | 27,987 | 80,971 | 6 | 43 |
| Salta | 354 | 39,319 | 65,830 | 74,783 | 331 | 23 |
| Córdoba | 318 | 37,039 | 55,811 | 63,138 | 264 | 54 |
| Río Negro | 240 | 36,239 | 51,059 | 61,860 | 221 | 19 |
| Corrientes | 257 | 29,136 | 50,364 | 56,319 | 233 | 24 |
| Formosa | 126 | 27,942 | 48,975 | 54,720 | 114 | 12 |
| Mendoza | 360 | 26,432 | 47,635 | 52,619 | 342 | 18 |
| Santiago del Estero | 128 | 20,947 | 44,998 | 49,687 | 121 | 7 |
| Entre Ríos | 231 | 26,276 | 41,913 | 46,801 | 204 | 27 |
| Jujuy | 159 | 18,938 | 27,983 | 31,379 | 148 | 11 |
| Neuquén | 116 | 14,813 | 26,886 | 30,080 | 102 | 14 |
| Chubut | 83 | 10,660 | 19,868 | 22,226 | 76 | 7 |
| Tierra del Fuego | 49 | 6,147 | 11,530 | 12,729 | 43 | 6 |
| San Juan | 81 | 5,563 | 9,528 | 10,597 | 73 | 8 |
| San Luis | 32 | 4,442 | 7,919 | 8,722 | 27 | 5 |
| La Rioja | 34 | 2,476 | 6,722 | 7,394 | 34 | 0 |
| Catamarca | 61 | 3,936 | 6,490 | 7,350 | 55 | 6 |
| Santa Cruz | 21 | 2,863 | 6,539 | 7,193 | 21 | 0 |
| La Pampa | 9 | 409 | 1,051 | 1,156 | 9 | 0 |
A.4 Satellite Imagery
References
Avis, W. R. (2016). Urban Governance (Topic Guide). Section: Informal settlements. Birmingham, UK: GSDRC, University of Birmingham. https://gsdrc.org/topic-guides/urban-governance/key-policy-challenges/informal-settlements/
Benitez, J. (2022). Moving on up?: The downside to the high life in Buenos Aires social housing. The Sociological Review Magazine. https://doi.org/10.51428/tsr.mjpu6817
Boo, G., Darin, E., Leasure, D. R., Dooley, C. A., Chamberlain, H. R., Lázár, A. N., Tschirhart, K., Sinai, C., Hoff, N. A., Fuller, T., Musene, K., Batumbo, A., Rimoin, A. W., & Tatem, A. J. (2022). High-resolution population estimation using household survey data and building footprints. Nature Communications, 13(1), 1330. https://doi.org/10.1038/s41467-022-29094-x
Breuer, J. H. P., Friesen, J., Taubenböck, H., Wurm, M., & Pelz, P. F. (2024). The unseen population: Do we underestimate slum dwellers in cities of the Global South? Habitat International, 148, 103056. https://doi.org/10.1016/j.habitatint.2024.103056
Carr-Hill, R. (2013). Missing Millions and Measuring Development Progress. World Development, 46, 30–44. https://doi.org/10.1016/j.worlddev.2012.12.017
Cravino, C. (2006). Las villas de la ciudad. Mercado e informalidad urbana. Los Polvorines: Universidad Nacional de General Sarmiento.
Cravino, C., Del Río, J. P., & Duarte, J. (2008). Magnitud y crecimiento de las villas y asentamientos en el Área Metropolitana de Buenos Aires en los últimos 25 años. In Encuentro de la Red Universitaria Latinoamericana de Cátedras de Vivienda. Buenos Aires: Universidad de Buenos Aires, Facultad de Arquitectura, Urbanismo y Diseño.
Gómez, S. (2022, May 6). Censo 2022: Cómo se relevará a la población en las villas y asentamientos de la Ciudad. Clarín. https://www.clarin.com/ciudades/censo-2022-relevara-poblacion-villas-asentamientos-ciudad_0_Z3OMMd3cPq.html
Infobae. (2023, December 19). Cinco millones de personas viven en barrios populares, según un relevamiento. https://www.infobae.com/sociedad/2023/12/19/cinco-millones-de-personas-viven-en-barrios-populares-segun-un-relevamiento/
Instituto Geográfico Nacional (IGN). (2021). Metadatos de la capa: Planta Urbana. Dataset: Hábitat e Infraestructura Social. Buenos Aires: IGN, Dirección Nacional de Servicios Geográficos. https://www.ign.gob.ar/capas-sig/metadata/planta_urbana.pdf
Instituto Nacional de Estadística y Censos (INDEC). (2023). Censo Nacional de Población, Hogares y Viviendas 2022: Condiciones habitacionales de la población, los hogares y las viviendas. Buenos Aires: INDEC. https://censo.gob.ar/wp-content/uploads/2023/11/censo2022_condiciones_habitacionales.pdf
Kuffer, M., Owusu, M., Oliveira, L., Sliuzas, R., & van Rijn, F. (2022). The Missing Millions in Maps: Exploring Causes of Uncertainties in Global Gridded Population Datasets. ISPRS International Journal of Geo-Information, 11(7), 403. https://doi.org/10.3390/ijgi11070403
Kuffer, M., Pfeffer, K., & Sliuzas, R. (2016). Slums from Space—15 Years of Slum Mapping Using Remote Sensing. Remote Sensing, 8(6), 455. https://doi.org/10.3390/rs8060455
Lebovits, N., Etulaín, J. C., & Duarte, C. (2025). Análisis de la exposición poblacional a peligros de inundación en el Partido de La Plata, Chapter 4: RENABAP. https://nlebovits.github.io/ciut-riesgo/renabap.html
Leete, R. (2001). Population and Housing Censuses: A Funding Crisis? Symposium on Global Review of 2000 Round of Population and Housing Censuses: Mid-Decade Assessment and Future Prospects. New York: UN Statistics Division, Department of Economic and Social Affairs. https://unstats.un.org/unsd/demographic/meetings/egm/symposium2001/docs/symposium_04.htm
Lucci, P., Bhatkal, T., & Khan, A. (2018). Are we underestimating urban poverty? World Development, 103, 297–310. https://doi.org/10.1016/j.worlddev.2017.10.022
Mahabir, R., Croitoru, A., Crooks, A. T., Agouris, P., & Stefanidis, A. (2018). A Critical Review of High and Very High-Resolution Remote Sensing Approaches for Detecting and Mapping Slums: Trends, Challenges and Emerging Opportunities. Urban Science, 2(1), 8. https://doi.org/10.3390/urbansci2010008
Marín, M. (2023, November 21). Más de un año y medio después. Por tercera vez, cambian la cifra de habitantes de la Argentina. La Nación. https://www.lanacion.com.ar/sociedad/con-demora-a-mas-de-un-ano-y-medio-del-operativo-difunden-los-resultados-definitivos-del-censo-nid21112023/
Microsoft. (2022). GlobalMLBuildingFootprints [Software]. GitHub. https://github.com/microsoft/GlobalMLBuildingFootprints
Ocar, C., Nadali, L. A., & Labat, S. D. (2023). Los tres últimos censos en la Argentina. La experiencia en la Provincia de Misiones. Población de Buenos Aires, 20(32). https://www.redalyc.org/journal/740/74077107002/
Okyere, F., Lu, M., & Brunn, A. (2025). Evaluating the Quality of Open Building Datasets for Mapping Urban Inequality: A Comparative Analysis Across 5 Cities. arXiv:2508.12872 [cs.DB]. https://arxiv.org/abs/2508.12872
RENABAP. (2023). Registro Nacional de Barrios Populares [Dataset, snapshot 6 December 2023]. Subsecretaría de Integración Socio Urbana, Secretaría de Obras Públicas, Argentina. https://www.argentina.gob.ar/sites/default/files/renabap-2023-12-06.geojson
Resa, S. D., Ríos, L. V., Rodríguez Daneri, M. E., Catino, N. S., Lara, J. M., Couyoupetrou, M., Aón, L. C., & Hernández, N. (2025). Plan Bicentenario de Ordenamiento Territorial de La Plata: Primera etapa. Municipalidad de La Plata; Facultad de Arquitectura y Urbanismo. http://sedici.unlp.edu.ar/handle/10915/184128
Reyes, A. (2021). Revealing the Contribution of Informal Settlements to Climate Change Mitigation in Latin America: A Case Study of Isidro Fabela, Mexico City. Sustainability, 13(21), 12108. https://doi.org/10.3390/su132112108
Rodríguez, M. C., Rodríguez, M. F., & Zapata, M. C. (2018). Mercantilización y expansión de la inquilinización informal en villas de Buenos Aires, Argentina. Revista INVI, 33(93), 125–150.
Samper, J., Pedrassoli, J., Jaramillo Espinosa, M., D'Attoli, J. M., Boanada-Fuchs, A., & Kuffer, M. (2025). Spatiotemporal Dynamics of Informal Settlements Across Argentine Cities: A National-Scale Analysis. SSRN Working Paper. https://ssrn.com/abstract=5588589
SIEMPRO. (2021). Estudio Barrios Populares: Condiciones de Vida, Vivienda y Hábitat en contexto de aislamiento social, preventivo y obligatorio. Informe Final. Buenos Aires: Sistema de Información, Evaluación y Monitoreo de Programas Sociales, Ministerio de Desarrollo Social. https://www.argentina.gob.ar/sites/default/files/informe_final-barrios_populares.pdf
Sirko, W., Kashubin, S., Ritter, M., Annkah, A., Bouchareb, Y. S. E., Dauphin, Y., Keysers, D., Neumann, M., Cisse, M., & Quinn, J. (2021). Continental-Scale Building Detection from High Resolution Satellite Imagery. arXiv:2107.12283. https://doi.org/10.48550/arXiv.2107.12283
SISU. (2023). Manual para la conformación y actualización del Registro Nacional de Barrios Populares. Buenos Aires: Subsecretaría de Integración Socio Urbana, Secretaría de Obras Públicas, Ministerio de Obras Públicas. https://www.argentina.gob.ar/sites/default/files/manual-para-la-conformacion-y-actualizacion-del-renabap.pdf
Smith, A., Bates, P. D., Wing, O., Sampson, C., Quinn, N., & Neal, J. (2019). New estimates of flood exposure in developing countries using high-resolution population data. Nature Communications, 10(1), 1814. https://doi.org/10.1038/s41467-019-09282-y
Thomson, D. R., Gaughan, A. E., Stevens, F. R., Yetman, G., Elias, P., & Chen, R. (2021). Evaluating the Accuracy of Gridded Population Estimates in Slums: A Case Study in Nigeria and Kenya. Urban Science, 5(2), 48. https://doi.org/10.3390/urbansci5020048
UN-Habitat. (2003). The Challenge of Slums: Global Report on Human Settlements 2003. London: Earthscan Publications, for United Nations Human Settlements Programme.
UN-Habitat. (2016). World Cities Report 2016: Urbanization and Development – Emerging Futures. Nairobi: United Nations Human Settlements Programme.
UN-Habitat. (2018). SDG Indicator 11.1.1 Training Module: Adequate Housing and Slum Upgrading. Nairobi: United Nations Human Settlements Programme.
VIDA. (2024). Google-Microsoft-OSM Open Buildings – Combined by VIDA [Dataset]. Source Cooperative. https://source.coop/vida/google-microsoft-open-buildings
Analysis conducted April 2026. Data and code available for reproduction.